
Exercises
-- Adult vs Newborn Size 2 --
This is a follow up to Adult vs Newborn Size 1.
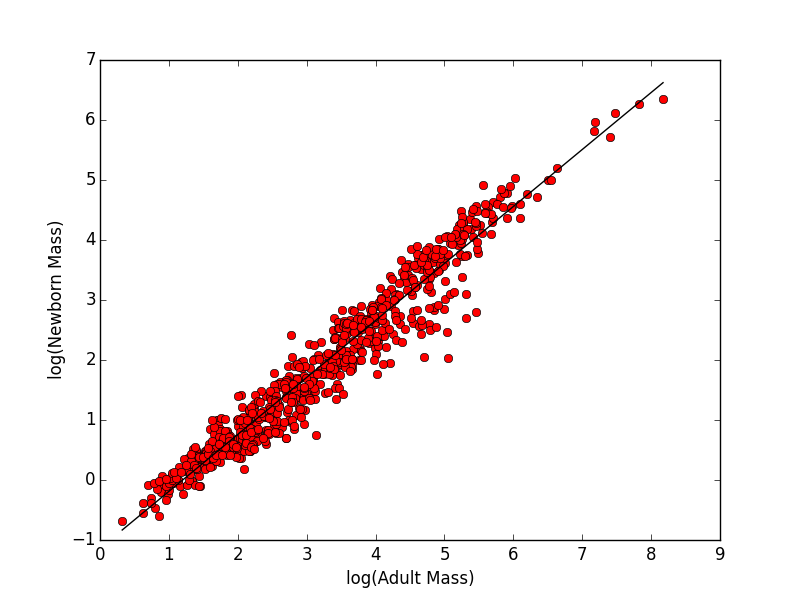
We’ve graphed the relationship between adult size and new born size in mammals and now it’s time to analyze the relationship statistically.
- Do a regression where x is log10(adult mass) and y is log10(newborn mass)
- Print the summary statistics for this regression
- Make a graph that shows both the data points and the regression line through those points. Label the axes
Optional: If you want, plot a histogram of the residuals of the regression to make sure that they are roughly normally distributed (you can do this with just a single line of code)
[click here for output] [click here for output]-- Shrub Volume 3 --
This is a follow up to Shrub Volume 2.
Dr. Granger is interested in studying the factors controlling the size and carbon storage of shrubs. This research is part of a larger area of research trying to understand carbon storage by plants. She has conducted a small preliminary experiment looking at the effect of three different treatments on shrub volume at four different locations. She wants to conduct a preliminary analysis of these data to include in a grant proposal and she would like you to conduct the analysis for her (she might be a world renowned expert in carbon storage in plants, but she sure doesn’t know much about computers). She has placed a data file on the web for you to download. She wants you to run an ANOVA to determine if the different experimental treatments lead to differences in shrub carbon.
- Import the data using Pandas and print out the first few rows of the data
using the
.head()method. - Write a function to calculate the shrub carbon using a column of lengths, a
column of widths and a column of heights, using the equation
1.8 + 2 * log(volume)wherevolumeis the volume of the shrub. You’ll need to use thenumpyversion of thelog()function. Call the function to
get a column of shrub carbons and then print out that column. - Use this function to get a column of carbons for all of the shrubs in the
table and append that column to your existing dataframe using a command like
data['carbon'] = get_shrub_carbons(lengths, widths, heights). Print out the entire dataframe. - Do an ANOVA to determine if the experiment has an influence on the shrub
carbon and print out the results in a standard ANOVA table using
anova_lm(). You can importanova_lm()usingfrom statsmodels.stats.anova import anova_lm.
- Import the data using Pandas and print out the first few rows of the data
using the
-- Mammal Body Size 4 --
This is a follow up to Mammal Body Size 1 and Mammal Body Size 3.
We have previously compared the average masses of extant and extinct species on different continents to try to understand whether size has an influence on extinction in mammals. We’ve done this by looking at the means and by comparing the histograms for extinct and extant species, but we haven’t done any statistics yet to actually test if the average sizes are different.
Perform either a two-sample t-test to compare the average sizes of the extinct and extant species in each continent.
Save the results as a
[click here for output]csvfile namedsize_comparison_results.csv, where the first column is the name of the continent, the second column is the average mass for the extant species, the third column is the average mass for the extinct species, and the fourth column is the p-value for whether or not they are different.